Sprays
Treatments analysis
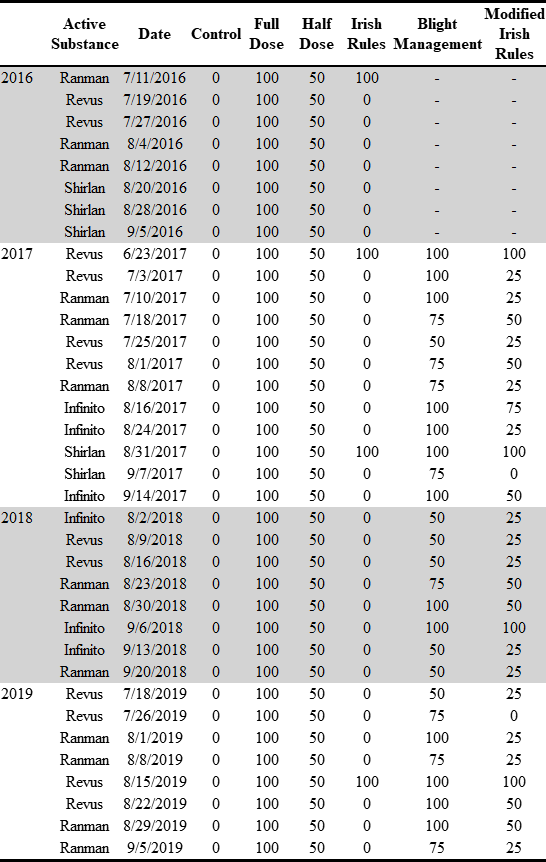
Number of treatments and proportion of the total dose used in fungicide trials.
Load packages
list.of.packages <-
  c(
    "tidyverse",
    "devtools",
    "egg",
    "hrbrthemes",
    "sjPlot",
    "effects",
    "lsmeans",
    "multcomp",
    "multcompView",
    "ggpubr",
    "tableHTML",
    "conflicted"
  )

new.packages <-
  list.of.packages[!(list.of.packages %in% installed.packages()[, "Package"])]

#Download packages that are not already present in the library
if (length(new.packages))
  install.packages(new.packages)

packages_load <-
  lapply(list.of.packages, require, character.only = TRUE)

#Print warning if there is a problem with installing/loading some of packages
if (any(as.numeric(packages_load) == 0)) {
  warning(paste("Package/s: ", paste(list.of.packages[packages_load != TRUE], sep = ", "), "not loaded!"))
} else {
  print("All packages were successfully loaded.")
}
rm(list.of.packages, new.packages, packages_load)

#Resolve conflicts
if(c("stats", "dplyr")%in% installed.packages()){
  conflict_prefer("filter", "dplyr")
  conflict_prefer("select", "dplyr")
}


#if instal is not working try
#install.packages("ROCR", repos = c(CRAN="https://cran.r-project.org/"))
Data import
tab <-
  read_csv(here::here("data", "treat", "Treatments.csv"))

years <-
tab %>%
group_by(Year) %>%
  summarise(counts =n())
year_names <-  unique(tab$Year)

tab[, "Year"] <-  NULL

html_tab <-
tableHTML::tableHTML(
  tab,
  rownames = FALSE,
  row_groups = list(c(years$counts), c(year_names)),
  widths = c(50, 60, 70, rep(50, 6))
) %>%
  # add_css_header(css = list('background-color', 'lightgray'), headers = c(1:ncol(tab)+1)) %>%
  add_css_row(css = list('background-color', 'lightgray'),
              rows = c(2:9, 22:29)) %>%
  add_theme('scientific')

tableHTML_to_image(
    html_tab,
    file = here::here("results", "treat", "Programme theme.png"),
    type = "png"
  )
dosedf  <- readRDS(file = here::here("data", "treat", "full_trt.rds") )


dosedf$treatment <-
  ifelse(
    dosedf$treatment == "Untreated Control",
    "1.Untreated Control",
    ifelse(
      dosedf$treatment == "Full dose (100)",
      "2.Full dose (100)",
      ifelse(
        dosedf$treatment == "Half dose (50)",
        "3.Half dose (50)",
        ifelse(
          dosedf$treatment == "Irish Rules (IRp)",
          "4.Irish Rules (IRp)",
          ifelse(
            dosedf$treatment == "Blight Man. (BMp)",
            "5.Blight Man. (BMp)",
            ifelse(
              dosedf$treatment == "Modified I. R. (MIRp)",
              "6.Modified I. R. (MIRp)",
              NA
            )
          )
        )
      )
    )
  )


dosedf$treatment <-
  factor(dosedf$treatment,
         levels = c("1.Untreated Control", "2.Full dose (100)","3.Half dose (50)","4.Irish Rules (IRp)","5.Blight Man. (BMp)" ,"6.Modified I. R. (MIRp)"))
The charts
# dosedf <- rename(dosedf, dose = Dose)
#Get number of treatments per year and the dose reduction
Summary <- function(x) {
  data.frame(
    n = length(x),
    treatments = sum(as.numeric(x != 0)),
    dose = round(sum(x) / length(x), 1)
  )
}

 p1 <-
dosedf %>%
group_by(year, treatment) %>%
  do(Summary(.$dose)) %>%
  ggplot(aes(
    x = year,
    y = dose,
    fill = treatment,
    group = treatment
  )) +
  geom_hline(yintercept = 50, colour = "gray")+
  geom_hline(yintercept = 100, colour = "gray")+
  geom_bar(
    color = "black",
    stat = "identity",
    position = position_dodge(),
    width = 0.9,
    size = 0.5
  ) +
  geom_text(
    aes(label = treatments, color = treatment),
    vjust = -0.3,
    position = position_dodge(0.9),
    size = 2.9
  ) +
  geom_text(
    aes(label = dose),
    vjust = 1.3,
    color = "white",
    position = position_dodge(0.9),
    size = 2.4
  ) +
  scale_fill_brewer("Programme:", palette = "Dark2") +
  scale_color_brewer("Programme:", palette = "Dark2") +
  scale_y_continuous(limits = c(0, 110), breaks = seq(0, 100, 10)) +
  theme_article() +
  facet_grid(~ year, scales = "free") +
  labs(x = "Year",
       y = "Proportion of the total dose (%)\n") +
  theme(
    axis.title = element_text(size = 11),
    panel.grid.major = element_blank(),
    panel.grid.minor = element_blank(),
    axis.text = element_text(size = 9),
    legend.position = "top",
    axis.text.x = element_blank(),
    axis.ticks.x = element_blank()
  )+
  theme(text = element_text(size=12))
 p1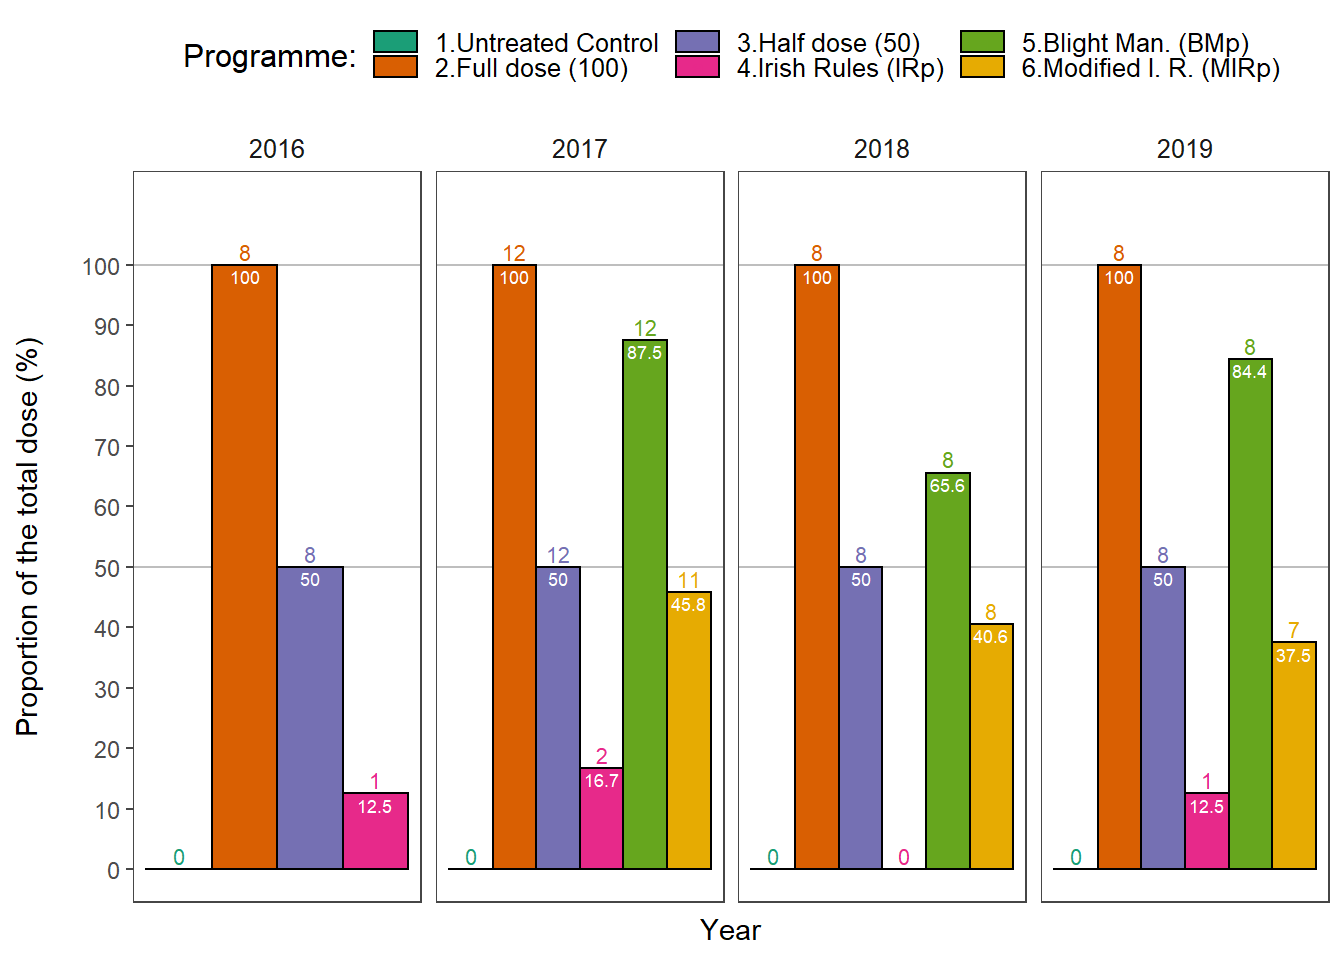
dose_summary <-
dosedf %>%
  group_by(year, treatment) %>%
  do(Summary(.$dose))


  p2 <-
  dose_summary %>%
  group_by(treatment) %>%
  filter(year != 2016) %>%
  summarise(mean_trt = round(mean(treatments),1),
            mean = round(mean(dose),1),
            sd = sd(dose)) %>%
  ggplot(., aes(
    x = treatment,
    y = mean,
    fill = treatment,
    group = treatment
  )) +
  geom_hline(yintercept = 50, colour = "gray") +
  geom_hline(yintercept = 100, colour = "gray") +

  geom_bar(
    color = "black",
    stat = "identity",
    position = position_dodge(),
    width = 1,
    size = 0.5
  ) +
  geom_errorbar(aes(ymin = mean - sd,
                    ymax = mean + sd),
                width = 0.2,
                color = "gray") +
  scale_fill_brewer("Programme:", palette = "Dark2") +
  scale_color_brewer("Programme:", palette = "Dark2") +
  theme_article() +
  scale_y_continuous(limits = c(0, 110), breaks = seq(0, 100, 20)) +
  theme(
    axis.title = element_text(size = 11),
    panel.grid.major = element_blank(),
    panel.grid.minor = element_blank(),
    axis.text = element_text(size = 11),
    legend.position = "none",
    axis.text.x = element_blank(),
    axis.ticks.x = element_blank(),
    legend.text=element_text(size=10)
  )

p2 <-

p2 +
labs(x = "Overall", y= "")+
theme(axis.text = element_blank(),
          axis.ticks.y = element_blank())+

 theme(legend.position = "none")+
  geom_text(
      aes(label = mean_trt, color = treatment),
      vjust = -0.3,
      hjust =  0.4,
      position = position_dodge(0.9),
      size = 3
    ) +
  geom_text(
      aes(label = mean),
      vjust = 1.4,
      hjust =  0.5,
      color = "white",
      position = position_dodge(0.9),
      size = 2.5
    ) +
    # coord_equal(2 / 1)+
theme(text = element_text(size=12))


p <- egg::ggarrange(p1, p2, ncol = 2, widths = c(4,1))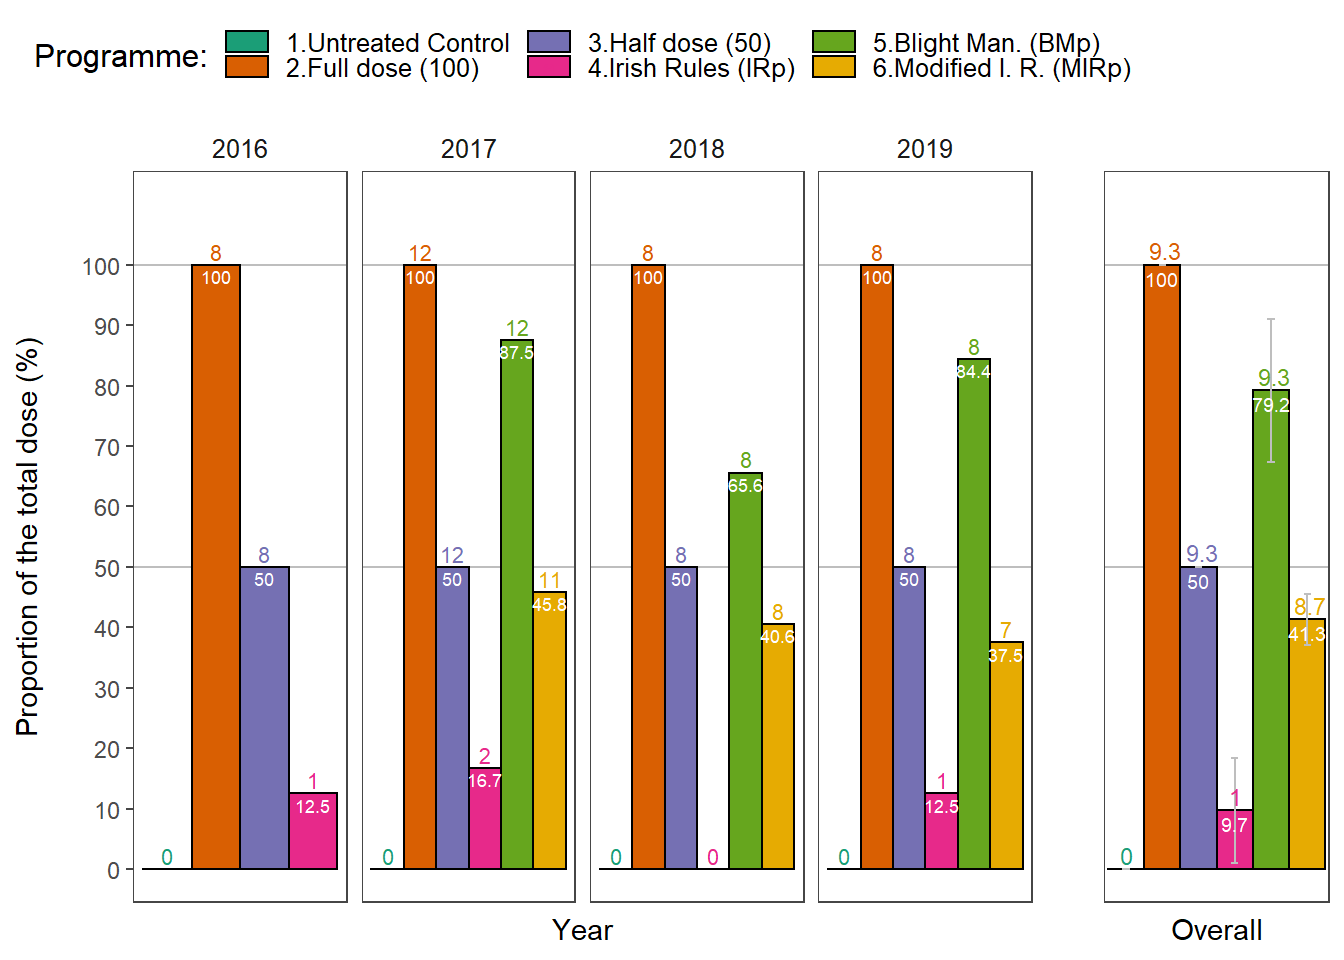
ggsave( here::here("results", "treat", "Treatments.png"),
        plot = p,
        width = 7.5,
height = 4)session_info()## - Session info ----------------------------------------------------------
## setting value
## version R version 3.6.3 (2020-02-29)
## os Windows 10 x64
## system x86_64, mingw32
## ui RTerm
## language (EN)
## collate English_United States.1252
## ctype English_United States.1252
## tz Europe/London
## date 2020-05-11
##
## - Packages --------------------------------------------------------------
## package * version date lib source
## assertthat 0.2.1 2019-03-21 [1] CRAN (R 3.6.1)
## backports 1.1.5 2019-10-02 [1] CRAN (R 3.6.1)
## boot 1.3-24 2019-12-20 [2] CRAN (R 3.6.3)
## broom 0.5.5 2020-02-29 [1] CRAN (R 3.6.3)
## callr 3.4.2 2020-02-12 [1] CRAN (R 3.6.3)
## carData * 3.0-3 2019-11-16 [1] CRAN (R 3.6.1)
## cellranger 1.1.0 2016-07-27 [1] CRAN (R 3.6.1)
## cli 2.0.2 2020-02-28 [1] CRAN (R 3.6.3)
## coda 0.19-3 2019-07-05 [1] CRAN (R 3.6.1)
## codetools 0.2-16 2018-12-24 [2] CRAN (R 3.6.3)
## colorspace 1.4-1 2019-03-18 [1] CRAN (R 3.6.1)
## conflicted * 1.0.4 2019-06-21 [1] CRAN (R 3.6.1)
## crayon 1.3.4 2017-09-16 [1] CRAN (R 3.6.1)
## DBI 1.1.0 2019-12-15 [1] CRAN (R 3.6.3)
## desc 1.2.0 2018-05-01 [1] CRAN (R 3.6.1)
## devtools * 2.2.2 2020-02-17 [1] CRAN (R 3.6.3)
## digest 0.6.25 2020-02-23 [1] CRAN (R 3.6.3)
## dplyr * 0.8.5 2020-03-07 [1] CRAN (R 3.6.3)
## effects * 4.1-4 2019-11-15 [1] CRAN (R 3.6.3)
## egg * 0.4.5 2019-07-13 [1] CRAN (R 3.6.1)
## ellipsis 0.3.0 2019-09-20 [1] CRAN (R 3.6.1)
## emmeans * 1.4.2 2019-10-24 [1] CRAN (R 3.6.1)
## estimability 1.3 2018-02-11 [1] CRAN (R 3.6.0)
## evaluate 0.14 2019-05-28 [1] CRAN (R 3.6.1)
## extrafont 0.17 2014-12-08 [1] CRAN (R 3.6.0)
## extrafontdb 1.0 2012-06-11 [1] CRAN (R 3.6.0)
## fansi 0.4.1 2020-01-08 [1] CRAN (R 3.6.3)
## farver 2.0.3 2020-01-16 [1] CRAN (R 3.6.3)
## forcats * 0.4.0 2019-02-17 [1] CRAN (R 3.6.1)
## fs 1.3.1 2019-05-06 [1] CRAN (R 3.6.1)
## gdtools 0.2.1 2019-10-14 [1] CRAN (R 3.6.1)
## generics 0.0.2 2018-11-29 [1] CRAN (R 3.6.1)
## ggplot2 * 3.2.1 2019-08-10 [1] CRAN (R 3.6.1)
## ggpubr * 0.2.4 2019-11-14 [1] CRAN (R 3.6.2)
## ggsignif 0.6.0 2019-08-08 [1] CRAN (R 3.6.1)
## glue 1.4.0 2020-04-03 [1] CRAN (R 3.6.3)
## gridExtra * 2.3 2017-09-09 [1] CRAN (R 3.6.1)
## gtable 0.3.0 2019-03-25 [1] CRAN (R 3.6.1)
## haven 2.1.1 2019-07-04 [1] CRAN (R 3.6.1)
## here 0.1 2017-05-28 [1] CRAN (R 3.6.1)
## hms 0.5.2 2019-10-30 [1] CRAN (R 3.6.1)
## hrbrthemes * 0.6.0 2019-01-21 [1] CRAN (R 3.6.1)
## htmltools 0.4.0 2019-10-04 [1] CRAN (R 3.6.1)
## httr 1.4.1 2019-08-05 [1] CRAN (R 3.6.1)
## jsonlite 1.6.1 2020-02-02 [1] CRAN (R 3.6.3)
## knitr 1.25 2019-09-18 [1] CRAN (R 3.6.1)
## labeling 0.3 2014-08-23 [1] CRAN (R 3.6.0)
## lattice 0.20-38 2018-11-04 [2] CRAN (R 3.6.3)
## lazyeval 0.2.2 2019-03-15 [1] CRAN (R 3.6.1)
## lifecycle 0.2.0 2020-03-06 [1] CRAN (R 3.6.3)
## lme4 1.1-21 2019-03-05 [1] CRAN (R 3.6.1)
## lsmeans * 2.30-0 2018-11-02 [1] CRAN (R 3.6.1)
## lubridate 1.7.4 2018-04-11 [1] CRAN (R 3.6.1)
## magrittr * 1.5 2014-11-22 [1] CRAN (R 3.6.1)
## MASS * 7.3-51.5 2019-12-20 [2] CRAN (R 3.6.3)
## Matrix 1.2-18 2019-11-27 [2] CRAN (R 3.6.3)
## memoise 1.1.0 2017-04-21 [1] CRAN (R 3.6.1)
## minqa 1.2.4 2014-10-09 [1] CRAN (R 3.6.1)
## mitools 2.4 2019-04-26 [1] CRAN (R 3.6.1)
## modelr 0.1.5 2019-08-08 [1] CRAN (R 3.6.1)
## multcomp * 1.4-10 2019-03-05 [1] CRAN (R 3.6.1)
## multcompView * 0.1-7 2015-07-31 [1] CRAN (R 3.6.1)
## munsell 0.5.0 2018-06-12 [1] CRAN (R 3.6.1)
## mvtnorm * 1.0-11 2019-06-19 [1] CRAN (R 3.6.0)
## nlme 3.1-144 2020-02-06 [2] CRAN (R 3.6.3)
## nloptr 1.2.1 2018-10-03 [1] CRAN (R 3.6.1)
## nnet 7.3-12 2016-02-02 [2] CRAN (R 3.6.3)
## pillar 1.4.3 2019-12-20 [1] CRAN (R 3.6.3)
## pkgbuild 1.0.6 2019-10-09 [1] CRAN (R 3.6.1)
## pkgconfig 2.0.3 2019-09-22 [1] CRAN (R 3.6.1)
## pkgload 1.0.2 2018-10-29 [1] CRAN (R 3.6.1)
## plyr 1.8.4 2016-06-08 [1] CRAN (R 3.6.1)
## prettyunits 1.0.2 2015-07-13 [1] CRAN (R 3.6.1)
## processx 3.4.1 2019-07-18 [1] CRAN (R 3.6.1)
## ps 1.3.0 2018-12-21 [1] CRAN (R 3.6.1)
## purrr * 0.3.3 2019-10-18 [1] CRAN (R 3.6.1)
## R6 2.4.1 2019-11-12 [1] CRAN (R 3.6.3)
## RColorBrewer 1.1-2 2014-12-07 [1] CRAN (R 3.6.0)
## Rcpp 1.0.4.6 2020-04-09 [1] CRAN (R 3.6.3)
## readr * 1.3.1 2018-12-21 [1] CRAN (R 3.6.1)
## readxl 1.3.1 2019-03-13 [1] CRAN (R 3.6.1)
## remotes 2.1.1 2020-02-15 [1] CRAN (R 3.6.3)
## reshape2 1.4.3 2017-12-11 [1] CRAN (R 3.6.1)
## rlang 0.4.5 2020-03-01 [1] CRAN (R 3.6.3)
## rmarkdown 2.1 2020-01-20 [1] CRAN (R 3.6.3)
## rprojroot 1.3-2 2018-01-03 [1] CRAN (R 3.6.1)
## rstudioapi 0.11 2020-02-07 [1] CRAN (R 3.6.3)
## Rttf2pt1 1.3.7 2018-06-29 [1] CRAN (R 3.6.0)
## rvest 0.3.5 2019-11-08 [1] CRAN (R 3.6.3)
## sandwich 2.5-1 2019-04-06 [1] CRAN (R 3.6.1)
## scales 1.1.0 2019-11-18 [1] CRAN (R 3.6.3)
## sessioninfo 1.1.1 2018-11-05 [1] CRAN (R 3.6.1)
## stringi 1.4.6 2020-02-17 [1] CRAN (R 3.6.2)
## stringr * 1.4.0 2019-02-10 [1] CRAN (R 3.6.1)
## survey 3.36 2019-04-27 [1] CRAN (R 3.6.1)
## survival * 3.1-8 2019-12-03 [2] CRAN (R 3.6.3)
## systemfonts 0.1.1 2019-07-01 [1] CRAN (R 3.6.1)
## tableHTML * 2.0.0 2019-03-16 [1] CRAN (R 3.6.1)
## testthat 2.2.1 2019-07-25 [1] CRAN (R 3.6.1)
## TH.data * 1.0-10 2019-01-21 [1] CRAN (R 3.6.1)
## tibble * 3.0.0 2020-03-30 [1] CRAN (R 3.6.3)
## tidyr * 1.0.0 2019-09-11 [1] CRAN (R 3.6.1)
## tidyselect 1.0.0 2020-01-27 [1] CRAN (R 3.6.3)
## tidyverse * 1.2.1 2017-11-14 [1] CRAN (R 3.6.1)
## usethis * 1.5.1 2019-07-04 [1] CRAN (R 3.6.1)
## vctrs 0.2.4 2020-03-10 [1] CRAN (R 3.6.3)
## withr 2.1.2 2018-03-15 [1] CRAN (R 3.6.1)
## xfun 0.10 2019-10-01 [1] CRAN (R 3.6.1)
## xml2 1.2.2 2019-08-09 [1] CRAN (R 3.6.1)
## xtable 1.8-4 2019-04-21 [1] CRAN (R 3.6.1)
## yaml 2.2.0 2018-07-25 [1] CRAN (R 3.6.0)
## zoo 1.8-7 2020-01-10 [1] CRAN (R 3.6.3)
##
## [1] C:/Users/mlade/Documents/R/win-library/3.6
## [2] C:/Program Files/R/R-3.6.3/library